About Charts

In Trakzee, Charts are a graphical representation of the data received by the objects. With the help of charts, the data can be analysed and understood more easily.
To open the charts screen, click on Menu > Chart in the application and select the preferred chart.
Below given is an example of a chart in Trakzee:
.png?width=688&height=353&name=charts%20(1).png)
Users can customize charts based on date selection, object selection, etc. as per their preferences and requirements. To do that, go to Chart > Click on ![]()

After clicking on the filter icon, tab will open on the right side of the screen as shown in the below given image where the user can select the preferred date, time and objects – the data of which the user wants to view.
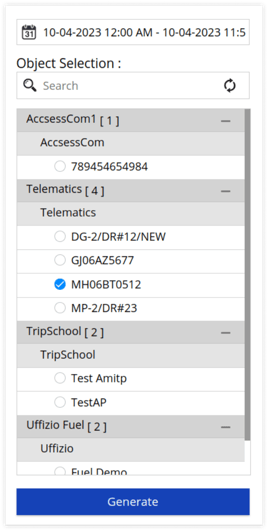
By clicking on generate, the chart for the selected time and objects can be viewed.
The software provides a variety of charts, including pie charts, line charts, and bar charts, to help users analyse fleet data. User can select the type of chart they want to view from the bar on the right side of the chart as shown below:

The users can also download the charts in .PDF format by clicking on the download button as shown below:

Some charts can also be viewed in textual form by clicking on the text file icon as shown below. These textual reports can be downloaded in XLS and PDF format as per requirement.

Users can get a wide range of charts with respect to different modules and features of the platform.
Decisions based on these charts can be made in order to increase the efficiency of the fleet and to optimise the performance of the vehicles.